 Cuando cumplió 9 años le regalaron su primera computadora: una TK83. Ese mismo día empezó a programar jueguitos y desde entonces ha sido autodidacta en el mundo de la informática.
Contemplum
The word contemplate stems from the Latin contemplum. It was the name given to an elevated platform that used to be in pagan temples. It was used to study the firmament at night and to discover from there, the designs of the gods. That is to say, what was going to happen. From contemplum arises the term contemplari which means “to look far away.”
To contemplate is to stare attentively, with interest! That interest comes from the value of what is observed. There are various ways to set in motion this observation in an attempt to achieve what is desired. In other words: how we observe defines what we obtain.
It is said in firms, repeatedly in a bleak way, that data provides value. But there is a lack of study in how to extract it. The value of data is not given by the data itself, but by the analysis techniques applied to it.
Every technique brings about a different type of value.
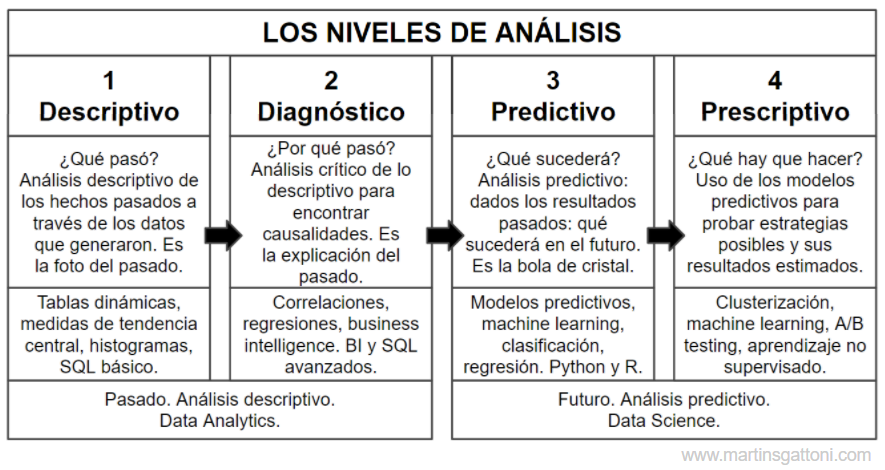
In Data Science, two methods of contemplation are defined in order to pull out different results: Descriptive Analysis and Predictive Analysis. Both are further divided into 2 sub-levels.
Looking back: Descriptive analysis
There is one main attribute that data has that is unquestionable: It is property of the past. When I do Descriptive Analysis I’m standing in the present, then I proceed to look back and then describe what happened.
The value to be obtained at this level results from answering the question: What happened?
As follows, most of the reports we consult in our BI are descriptive in nature:
- Monthly sales history of the last year.
- Users who made complaints in the last 90 days.
- Customers who bought above the average in their last order.
The classic Data Science tools for Descriptive Analysis are: pivot tables in Excel, measures of central tendency, histograms, basic SQL.
If in this historical description of what I observe in data, I add exploration techniques to find the reasons for what happened, I will also be doing Diagnostic Analysis.
The value to be obtained at this level springs from answering the question: What happened?
Some examples of diagnostic reports are:
- History of my sales in comparison to the evolution of the total market.
- Correlation between economic variables and my demand.
- Evolution of demand facing price variations.
The classic Data Science tools for Diagnostic Analysis are: correlations, regressions and advanced SQL.
What is to predict?
Predictive Analytics is not about guessing the future, it is a different form of contemplation. Let’s make an obvious point: this type of analysis is also done on the same source: data from the past. We do not have information from the future to predict (unless we are sighted). The raw material is the same.
Therefore, when we talk about Predictive Analytics we are referring to a particular set of analysis techniques. Unlike the levels already described, where the goal is to obtain a representation of what happened, in the predictive levels, we seek to create the most probable future scenarios based on the historical analysis of what happened.
The results of the predictive models will always be associated with a probability of occurrence that has to do with the certainty that the model assumes about itself. I will not go deeper into this topic today. However, I will say that predictive techniques are capable of evaluating themselves and give a degree of credibility to their results.
It is crucial to understand this idea of probability associated with the result itself. Usually, when I adopt models of this type with my clients, they find it very difficult to understand the results in terms of probability and they fail to use the tool. The issue is that we are used to understand data in a deterministic way (descriptive.)
Let’s clarify this idea with an example. I propose you to think about this: there is a predictive model that most people consume on a daily basis. Guess what it is?
You might have thought about the weather forecast. This is a clear example of Predictive Analytics that we are familiar with. Note that it fulfills everything I just said: it is a way of analyzing data from the past that aims to estimate the most likely future scenario.
Note that the idea of a probability associated with each outcome becomes distinct: what does it mean if we say that tomorrow there is a 60% chance of rainfall? Well, simplifying matters, 60% is our probability indicator on our most likely outcome, rainfall. And it is implied as follows: the model is saying that in the historical analysis of the data, given the same weather conditions (temperature, humidity, wind, pressure, etc), it rained on 60% of the days.
On one hand, the probability of occurrence does not take place in Descriptive Analysis because the results are deterministic: they have already happened. On the other hand, in Predictive Analysis there is uncertainty. Events are never repeated in the same way. Moreover, our data is always insufficient, we do not have all the information. It is necessary to guess from scraps. In my classes, I like to explain this with Laplace’s Demon.

“We can look at the present state of the universe as the effect of the past and the cause of its future. One could conceive of an intellect which at any given moment knew all the forces animating nature and the positions of the beings composing it; if this intellect were vast enough to submit the data to analysis, it could condense into a simple formula the motion of the great bodies of the universe and of the lightest atom; for such an intellect nothing could be uncertain and the future, as well as the past, would be before its eyes.”
Pierre-Simon Laplace
Pierre-Simon Laplace was a French astronomer and philosopher. He used to postulate that the supreme end of science was to forecast everything by understanding causes and their effects. His way of thinking was deterministic: he supposed that if there were a demon capable of foreknowing all properties of all particles in the universe, that living being would be able to predict the future perfectly.
Laplace’s deterministic point of view is fundamental due to the fact that it is based on an assumption that we should necessarily agree with in Data Science: the more information I have, the better I can estimate what is going to happen.
Looking ahead: Predictive Analytics
We will then include within Predictive Analytics the set of statistical and Machine Learning techniques that generate predictive models based on the disclosure of patterns in past data.
The value to be obtained at this level begs the question: What will happen?
Some of these techniques are:
- Forecasting with time series to estimate the future evolution of demand, turnover, supply chain.
- Churn risk segmentation models to detect customers that require special attention.
- Classification or regression models to automate categorization processes such as: travel allowance approval, fraudulent activity detection, new customer segmentation.
Data Science tools to perform Predictive Analytics are: predictive models, Machine Learning, classification, regression, Python and R.
However, it does not end here. We can also provide predictive models with steering abilities. In this case, we call it the last level of Prescriptive Analytics. It consists of models that, beyond predicting, they also suggest what we should do in the face of the probable scenario that is approaching.
The value to be obtained at this level arises from answering the question: What is to be done?
Some Prescriptive techniques are:
- A/B Testing type promotional actions to determine the most efficient actions to implement.
- Development of cross-selling or up-selling combos based on the use of Basket analytics models.
- Detection of clusters by risk and value to discriminate actions on each customer segment.
Data Science tools for Prescriptive Analytics are: scalar segmentation, Machine Learning, A/B testing, unsupervised learning.
A real case
Let’s bring these concepts down to earth and focus specifically on the marketing industry, which is the one we are interested in: a few months ago, we implemented our tool Florensys.com for a multinational pharmaceutical company in Argentina. The goal was to provide their patient loyalty program with a “data intelligence” superior to the one they had, which was quite elementary.
Florensys is a tool created by our company that automates and centralizes several of the predictive models for marketing that I´ve already mentioned:
- We have adopted a classic RFM segmentation model to perform an initial Descriptive Analysis of the patient target.
- We have made correlation and evolutionary reports of the different variables for the Diagnostic Analysis that allowed us to distinguish some problems in the execution of the program.
- We have developed a Risk Model that analyzed the consumption patterns of each patient and segmented them by level of propensity to drop out.
- Considering the results of the segmentation and the Risk Model, we created a Marketing Automation program tailored to each patient.
- With these models and their results, customized communication pieces were formatted and created for each segment. For example: communications based on the importance of treatment continuity were reinforced for clusters with low compliance.
- Individual contact frequencies have been determined according to each patient’s risk of abandonment: why bother with messages to those who are not at risk?
- The channel mix was reformulated for each patient based on their CLTV: the most expensive channels will be used for patients with the highest future value.
This type of analysis can be introduced on any type of target. In our case, we have also applied it to physician targets (based on prescription audits) and pharmacy targets (based on their transfers). And it works for any industry: we are currently conducting a pilot experience with an important chain of gyms. It also works very well in e-commerce.
To sum up: All things considered, having a clear understanding of the Levels of Analysis (Descriptive, Diagnostic, Predictive, Prescriptive) is the first way to understand all the value hidden in our data. The next step is to define the strategy.
Lic. Martín Marcelo Sgattoni
www.idealsur.com


Comentarios recientes